No.1 is simply reading the
chart wrong. An example of this is, believing you are trading an uptrend when there is in fact
no trend at all, or not seeing that there has been
break in the trend, which leads to a complete reversal. This type of error generally only applies to
early stage/beginner traders however, and the good news is, it has much less impact on consistency once you learn how to read price action.
No. 2 however, is very different and is what this post is about, and is without doubt the main reason why I see so many still struggle for consistency, even after they have
'mastered' price action. Its simply because they do not understand the dynamics that have been driving a market have
changed. Let me explain. Forex is a very unique market, in that you can trade
various combinations of the same thing, NZDCAD, NZDCHF, NZDJPY etc etc. Buying any one of these three markets mean you are buying NZD, but it also means you are by
default selling the currency on the other side, and if you do not understand what
caused the movement in the first place, then you could very easily be trading at either the
wrong time or
the wrong combination, and this is what casues the mistakes and loses.
The problem is the fact a chart will very often on the surface look fine, as in the trend is still intact and price action is still agreeing with the trend, which is why understanding price action alone won't lead to consistency. The NZDCAD daily chart below is a great recent example of how everything can look fine on the surface but there are alarm bells ringing if you look a little deeper. Firstly, NZDCAD can go up for two reasons, either NZD is much stronger than CAD or CAD is much weaker than NZD, both scenarios will result in NZDCAD moving higher. The best scenario is of course when NZD is strong and CAD is weak, as this will produce the strongest upward momentum in a market, exactly what happened during the uptrend in the image below.
How do I know NZD was strong and CAD was weak? Well, the chart below also contains a
currency strength indicator at the bottom of the chart, which measures the overall strength of each currency, and I will use this to help illustrate my point. During the NZDCAD uptrend, you can see that the yellow NZD line was moving
higher, meaning NZD was getting stronger and the green CAD line was
falling, meaning CAD was getting weaker, the
perfect uptend conditions. However, at the end of the 3rd cycle, as price retraced back to the blue 20 moving average, and many traders were considering taking another long position, the
dynamics of this chart at already changed.
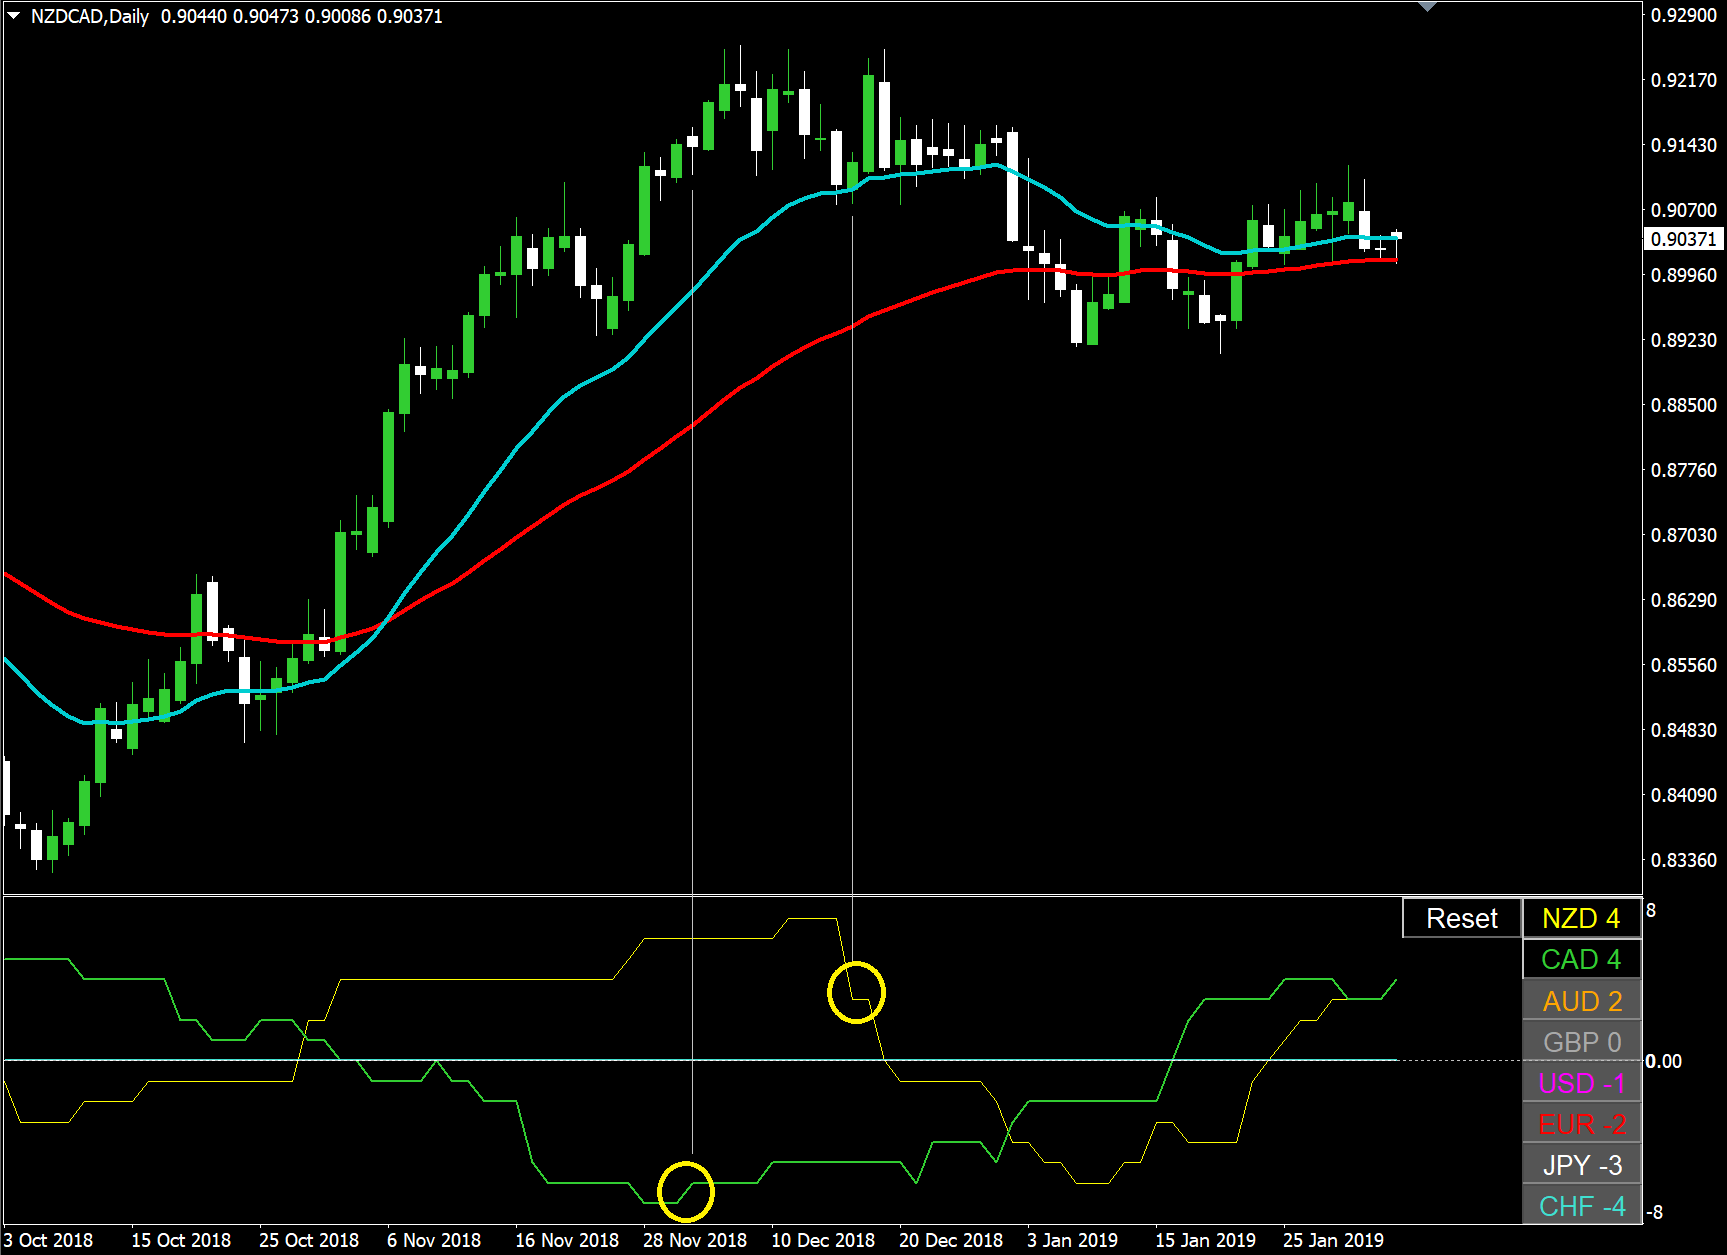
In this example, as is very often the case, the dynamics of the 2nd currency (the one most people don't consider) are changing and we can see that it is actually getting stronger, represented by the fact the green line has stopped falling and is now in fact moving higher. This happens before the cycle is complete and is the reason momentum begins to slow in this market. Price then continues to cycle back to the 20 moving average and at that point we see another major alarm bell in the indicator (but not on the chart) and that is the fact the yellow line NZD has dropped, meaning NZD is getting weaker.
The dynamics that caused this chart to move higher have completely disappeared, NZD is now too weak to buy and CAD is too strong to sell, and this trend is ultimately over. Unfortunately, it took price action a little time to catch up, and although eventually it did and the market moved lower, all too often it will give you just enough time to enter the market, and then get caught out on the wrong side. Sound familiar? It should do, because I see traders make this mistake every week.
Let me show you another example, but this time in a little more detail. Below is a 4 hour chart of CADCHF and again with the
currency strength indicator at the bottom of the chart. Notice how at
point 1, both lines on the indicator start to
diverge (move away from each other) and the chart moves higher. This is because
CAD is getting stronger and
CHF is getting weaker. At
point 2, the chart begins to consolidate and move sideways because both currencies strength have converged and they
now have equal strength (both have a strength around 0 meaning neither is strong or weak). Then again at
point 3, both lines start to diverge and the market rallies again. Trading when the conditions are the same as point 2 (equal strengths), will lead to a
greater number of losses.
These two examples illustrate the conditions in the market where you are
incurring most of your losses and are stopping you from being consistent. You are either trading a market just as its conditions are changing (NZDCAD example) or when the conditions aren't right (CADCHF example). If you master this,
you will become consistent.
Conclusion.
When trading forex its not only important to understand price action, you must also understand whats
driving the price action in the first place. Yes, I may have cheated a little and used a
currency strength indicator to make it easier for me and save me some time, but you don't need to use an indicator. You can do this manually simply by looking at each combination of
BOTH currencies you want to trade (one buy and one sell) and asking yourself, should I really be
buying X and should I really be
selling Y? The price action across all of their charts (not just that one chart in isolation) will tell you if the
dynamics remain the same or if they are changing.
Trade if they remain the same, avoid if they are changing.
Try it for yourself over the next few weeks and try to look at charts from a
different angle. Don't just read price action, try to
anticipate it and understand what movement it could cause next.
|By Ray Gilmour|