Cycle Finder Pro
Metatrader Indicator on MT4 & MT5
Current version - 4.0
Published - December 2016
Updated - November 8th 2020
Are you a trend or pattern trader looking to improve your chart reading or speed up your analysis? Cycle Finder Pro has been specifically designed to spot the true cycles in the market, making it much easier to confirm trend and chart patterns.
- Quickly identify all market trends
- Makes chart reading easier than ever before
- Indicator knows when to 'ignore' extreme news price action
- Reads any chart, Stocks, Forex or even Commodities
Nov 2020 - Version 4.0 now includes trend change signal, making reading your charts even easier. Indicator will now tell you what trend is currently on any chart, saving you time and helping you cut out chart reading mistakes.
Reading a chart correctly requires the knowledge of a minimum of 4 points at all times, chart patterns such as Head & Shoulders require 5 points. Get any of these points wrong and you will make the wrong trading decision. Take the guess work out of chart reading and let this clever chart reading indicator do the hard work for you.
- Know exactly what a chart is doing before taking a trade
- Uses time frame correlation to confirm cycles
- Does not mark 'false' cycles like other indicators such as Fractals or ZigZag
- Can be used to confirm trend, as well as continuation and reversal patterns
The ultimate chart reading indicator
This intelligent chart reading indicator uses the rules and techniques taken from our universal guide on '
how to read a chart', the first guide of its kind that clearly defines the characteristics of true market cycles.
The complexity of chart reading means it's very hard to consistently read every chart the same way which in turn makes it very easy to get it wrong, and it is for these reasons Cycle Finder Pro was created. In our experience working with many traders from around the world, we have seen time and again simple trading mistakes made because of misreading the trend on a chart. Remove the guesswork from chart reading and improve the consistency of your trading results by allowing this indicator to show you want is happening on every chart.
Ideal for traders who are still learning to trade, and need a guide to help them on their journey, and also for more experienced traders, who struggle with consistency.
Video - Introduction to Cycle Finder Pro
Trend test
Can you spot every cycle on this chart? There are
17 confimed highs and lows on this chart that make up its cycles. See how many you can find. The answer is further down this page.
Anatomy of the indicator
To understand cycles you must understand time frame correlation and the special relationship between two time frames. This indicator reads and understands the shape and size of every bar on a chart and can determine if the 'correct' price action is in place for a 'true cycle' in the market. Cycle Finder Pro does not predict when or where cycles will occur on a chart, it confirms them, so you don't have to.
Cycles are made of points called highs and lows, and these points are the peaks and troughs of the cycles. The movement of markets however is never uniform so knowing which high and low to consider make a cycle is much harder than it sounds.
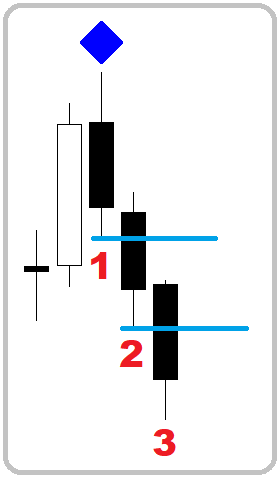 What confirms a 'High'
A high can only be confirmed as a high once at least 2 subsequent bars have ‘taken out’ the low of the previous lower bar. Here you can see how during the formation of bar 2, price moved down through the blue line representing the lowest price traded on the previous bar, bar 1, and in the process ‘taking out’ bar 1’s low. Bar 3 then proceeded to pass down through the blue line representing the lowest price traded in bar 2, ‘taking out’ day 2’s low and establishing a 2nd lower bar. It’s only at this point that the high of bar 1 can be confirmed as a high.
What confirms a 'High'
A high can only be confirmed as a high once at least 2 subsequent bars have ‘taken out’ the low of the previous lower bar. Here you can see how during the formation of bar 2, price moved down through the blue line representing the lowest price traded on the previous bar, bar 1, and in the process ‘taking out’ bar 1’s low. Bar 3 then proceeded to pass down through the blue line representing the lowest price traded in bar 2, ‘taking out’ day 2’s low and establishing a 2nd lower bar. It’s only at this point that the high of bar 1 can be confirmed as a high.
N.B. When establishing a high it is important that the bars following bar 1 do not take out its high. See how bars 2 and 3 have a lower highest trading price than bar 1.
What confirms a 'Low'
As with confirming a high, the same is also true for confirming a low, just in reverse. Here you can see how during the formation of bar 2, price moved up through the blue line representing the highest price traded on the previous bar, bar 1, and in the process ‘taking out’ bar 1’s high. Bar 3 then proceeded to pass up through the blue line representing the highest price traded in bar 2, ‘taking out’ day 2’s high and establishing a 2nd higher bar. It’s only at this point that the low of bar 1 can be confirmed as a low.
It is also important that during the formation of bars 2 and 3 that the low of these bars does not take out the lowest price traded in bar 1. If this happens then the count must start again from this new low point.
How the indicator deals with News
There will be bars during the formation of a chart that are shaped by news or events that have surprised the market, and as a consequence, cause extreme price action or what we prefer to call 'over-sized bars'. While these type of bars don't happen very often, it is important that they are dealt with in the correct way. Some can be 'ignored' as the chart returns to normal soon afterwards, while others can not be 'ignored' as they completely change the structure and tone of that market. Cycle Finder Pro is designed to deal with these extreme events so you are not left second guessing what to do.
You can see one example below where the indicator has identified that an extreme event has occurred and has determined that the structure of this market has changed, and from this point it 'resets' its trend. This is an important point as it means a trader is best to leave this market until a new trend is confirmed.
Trend test answer
Below we have the same chart we showed you above, only this time we have applied Cycle Finder Pro to it. How did you do in the test? Did you find all the cycles? Now ask yourself, is it easier with Cycle Finder Pro on the chart?
We can now see all 17 highs and lows easily and from this we can see the market moves through 4 different periods of trend. We start with no trend which turns to an uptrend (higher highs and higher lows), we then change into a down trend (lower highs and lower lows), followed again by a brief uptrend.
A lot of traders misread trend and is one of the main reasons behind inconsistency in trading results. Reading every chart exactly the same isn't easy, why not let this clever indicator do the work for you.
Settings and Parameters
On first loading the indicator, you will be presented with a number of options as 'input parameters'. The indicator has already been optimized to read price action in the best possible way and these canont be changed, but we have given a few settings you can adjust. They are easy to understand but if there is any doubt we have outlined below what they each mean.
Marker Offset:
This is the distance in pips the marker is positioned above or below a confirmed point. There is no optimal distance and this does not affect the performance of the indicator.
ATR Multiplier:
ATR is used to determine if a bar is over-sized or not. We use a default ATR of 3, meaning any bar greater than 3 ATR, will be clasified as an oversized bar and the indicator will then act accordingly, following its guidelines on how to respond to over-sized bars. you can change the ATR value so more bars (smaller ATR value) are considered over-sized, or less bars (larger ATR value) are considered over-sized bars. We recommend the default of 3 is used unless you are an advanced trader.
Trend text:
Choose what name to give each type of trade. Uptrend, downtrend and no trend are shown as default.
Trend color:
Choose what color to assign to each trend type. Green, yellow and red are set as default.
Trend size:
Choose what size of text and directional arrow you wish to display on you chart.
Trend corner:
Choose which corner to display the trend. Bottom right hand corner is shown as default.
Download today and join the thousands of traders around the world who already
use Cycle Finder Pro to spot trend and chart patterns.
Download includes...
Lifetime technical support and unlimited free software updates
Need help installing? Check out our installation video
HERE