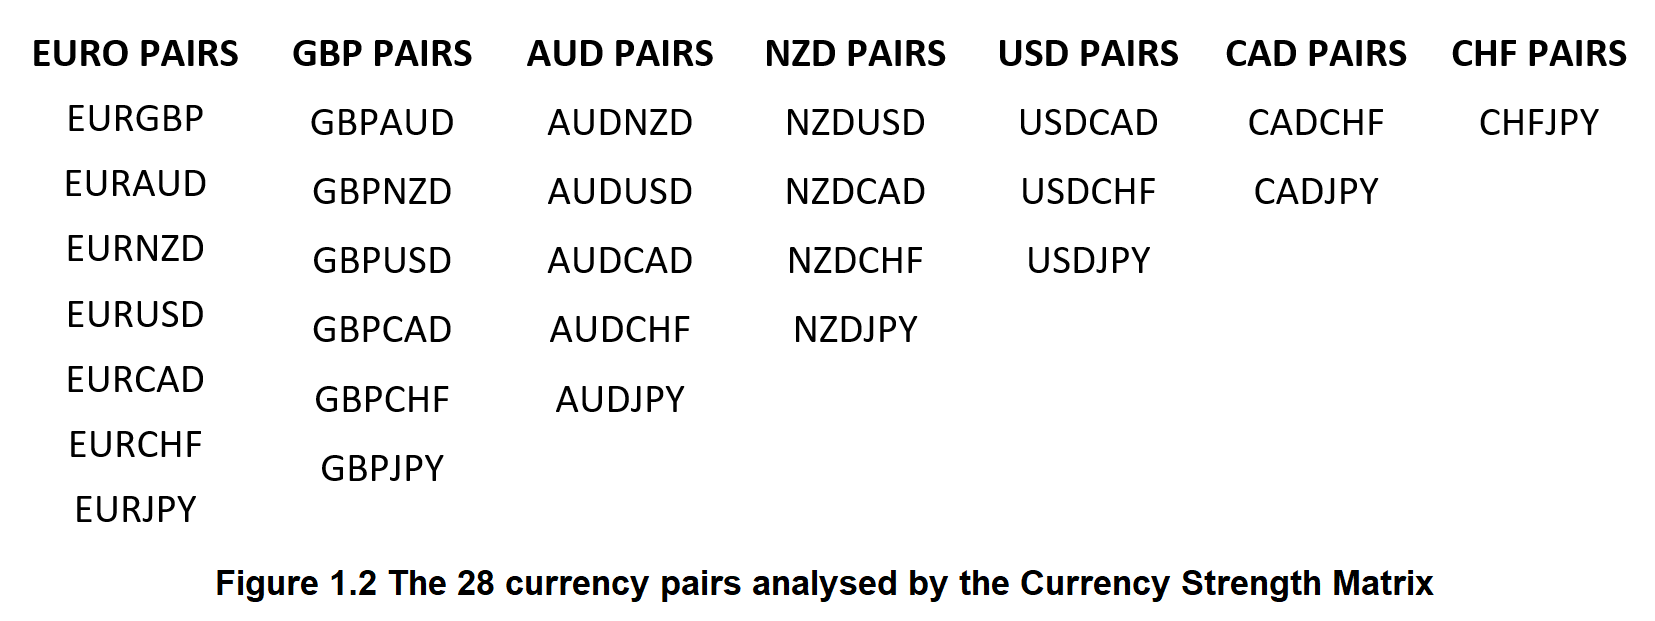
There are many more currencies available to trade than those presented in the Matrix, however due to liquidity and the fact that these currencies make up the vast majority of
daily trading volume, the Matrix has been restricted to these 8 major currencies making up 28 currency pairs.
As a technical trader, reading a chart consistently is critical in your aim to take money from the market. I say consistently instead of correctly as there is no one correct way, we can all trade differently and therefore see things differently, but we
must always individually be consistent in how we do it. Unfortunately however, we are all human and prone to errors, whether you’re a beginner or an experienced trader. In most aspects of our lives we can get away with small errors, but in trading, errors cost money.
In our experience working with clients, the vast majority of these errors, and subsequent loss of money, have been due to a misreading of the chart derived from a lack of consistency and therefore avoidable. These are the worst kind of trading mistakes and eat into your trading capital more than any other. It is for this reason the Matrix was developed in an effort to help traders
remove the possibility of discretionary and unnecessary errors resulting in losses.
Before we get into using and implementing the Matrix in our trading, we must establish the
rules for reading a price chart as this is how we determine the strength and scoring we see on the Matrix, Figure 1.1. Firstly it must be remembered that the Matrix shown on the webiste is based of the daily time frame, but the following rules for trend identification can be applied to any time frame. All charts illustrated hereafter are using daily time frames.