74% success rate trading strategy

Does your trading strategy have a 74% or greater success rate? If the answer is no, or worse still, you don’t know your success rate and simply watch to see if your account balance is going up or down, then
you need what I am about to show you in your trading tool kit.
We have just completed extensive back testing on all our optimum seasonal patterns through 2023, and we have been amazed by what we found. Our optimum seasonal patterns have a 74% success rate across all asset classes, with some assets reaching a staggering 90% success rate on their own. In this update I’m going to show you how our optimum seasonal patterns have transformed the use of seasonality in trading, and how you can make this success rate even higher in your own trading strategy.
Strategy Back test results
The results showed a 74% success rate across all asset classes from currencies to metals, with stock indices having the best performance with a truly staggering 90% success. Just think of that for a second, that’s 10 different markets over the course of the entire year with patterns that had a 90% success rate. How many of them did you take? US stocks were next on the list with a 75% success rate. UK stocks were 69% and major FX pairs were 64%.
What’s even more staggering about our back testing results is that it was based on something we always say not to do, and that is simply entering the market on the pattern start date and closing on the end date. A very inefficient way to trade them and the reason why the success rate isn't much higher. We did this for fairness and to see just how good the seasonal AI is at finding true seasonal patterns, without any trade entry confirmation or trade management, but it leaves a lot of room for the success rate of the patterns to be improved even more.
Why seasonal correlations matter
Most traders (including experienced professionals) have always used seasonal patterns in such a way that they look at the upcoming expected direction of a market but give little thought about what the market is actually doing right now. By that I mean they don’t look to see if the market is already following an expected pattern before it enters the next stage of the pattern. They simply expect it to suddenly behave in a predictable manner even though it isn't doing that in its current state. THIS LEADS TO MANY SEASONAL ERRORS.
I have always taught traders to confirm if current price action is following the current pattern, but this can be tricky for new traders so with our new seasonal platform we actually tell you if a market is following a pattern or not. The first seasonal pattern provider to do this. This matters because there is a significantly higher probability of a market performing as you expect in the future if it is already doing what you expect right now. Our back testing confirmed this by proving that seasonal pattern success rates across all assets are substantially higher when the market is positively correlated with its seasonal pattern. The results showed that when looking across all patterns regardless of correlation, the success rate dropped from 74% to 62%. That’s a big drop and one that will have a significant negative impact on your trading strategy.
If you are relatively new to seasonal trading, a good rule of thumb I recommend is to look for markets with at least a 50% correlation with its pattern. These correlations can be found on many areas of our platform but the clearest is directly above every seasonal chart, where you will see the correlations for 3 seasonal patterns just as the image below. Look for which ever pattern has the strongest correlation but if more than one is strong then they will likely be saying the same thing anyway so it won't matter which you choose.

Make your trading strategy even better
As I said earlier, our testing was based on entering on the start date and holding to the end date, with no entry confirmation or trade management. A very inefficient way to trade, so I want to show you how to improve the success rate even further. Something to remember is that a pattern can start earlier or later than the expected date. I often refer to a 'seasonal window' of anything from 5 – 10 days either side of the expected date. This is why it’s important to look for the best patterns ahead of time as they will often start earlier than expected.
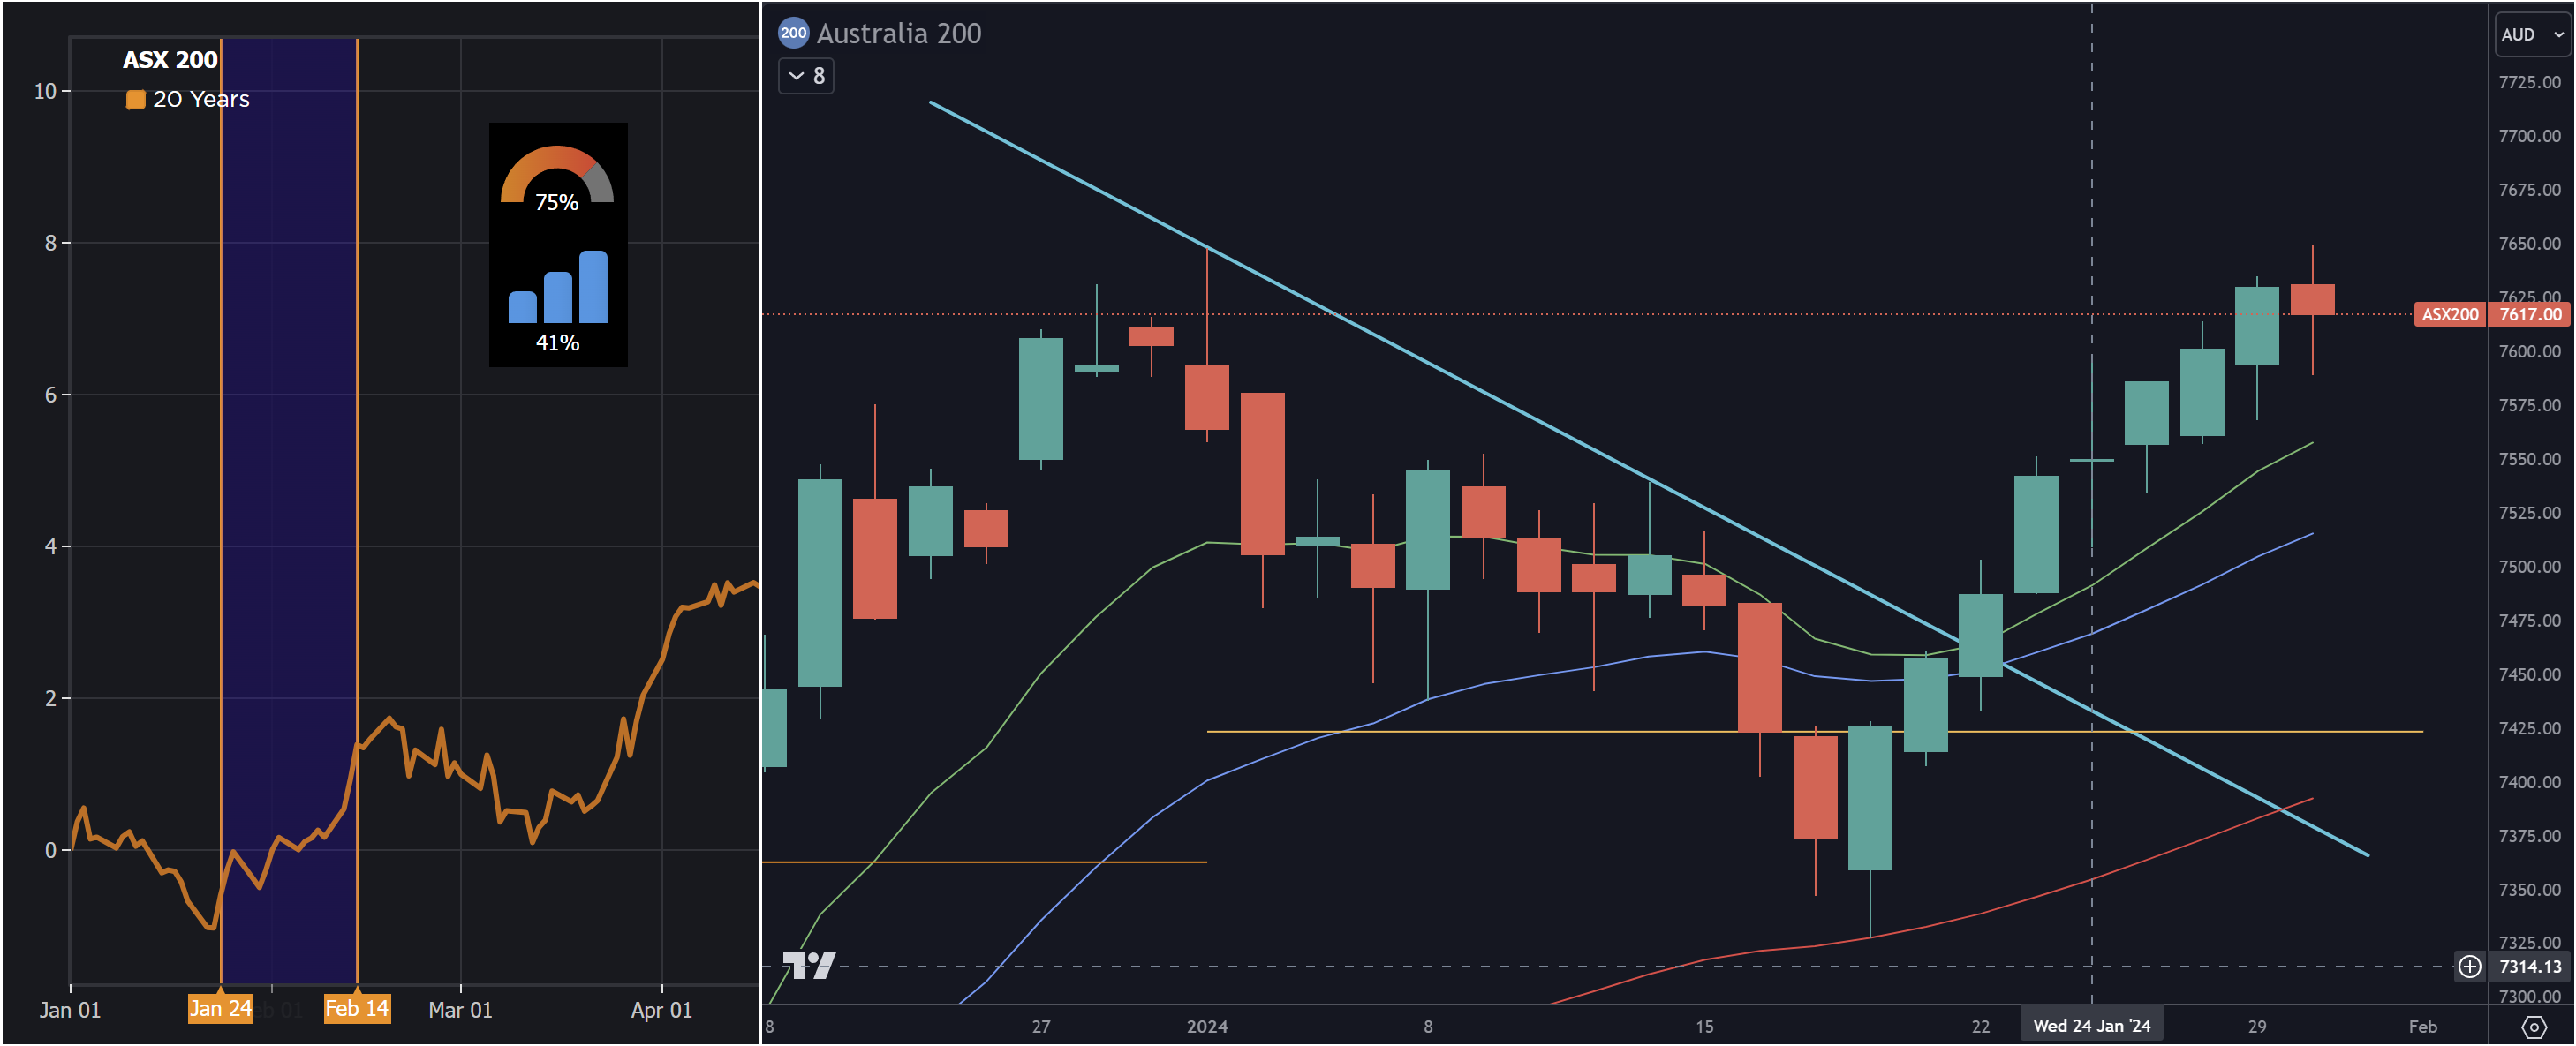
Below is a recent example in the ASX 200 stock index. We can see on the left our seasonal chart showing an optimum pattern from January 24th to February 14th. The orange line shown here is the 20-year seasonal pattern as that was the strongest correlated with price at the time, at 58% positive correlation. You can see on the chart on the right, however, that by the 24th, the index had already been going up for 4 days, breaking many levels of resistance in the process. Bullish price action started as early as the 18th with the bullish engulfing candle, and we had a series of candles with bullish strong closes to follow, and also breaking through trendline resistance on the 22nd. It’s at this point I would personally look to enter, but if your strategy allows you to enter even earlier that’s great. The key thing is that our optimum pattern finder will typically identify the sweet spot in the middle of a pattern, but the pattern will often start earlier. Just as the orange 20-year pattern below shows a low being formed before the pattern start date. Once in a trade and price is moving in your favour, you can apply simple trade management techniques to ensure this does not become a losing position. Something we did not account for in our tests.
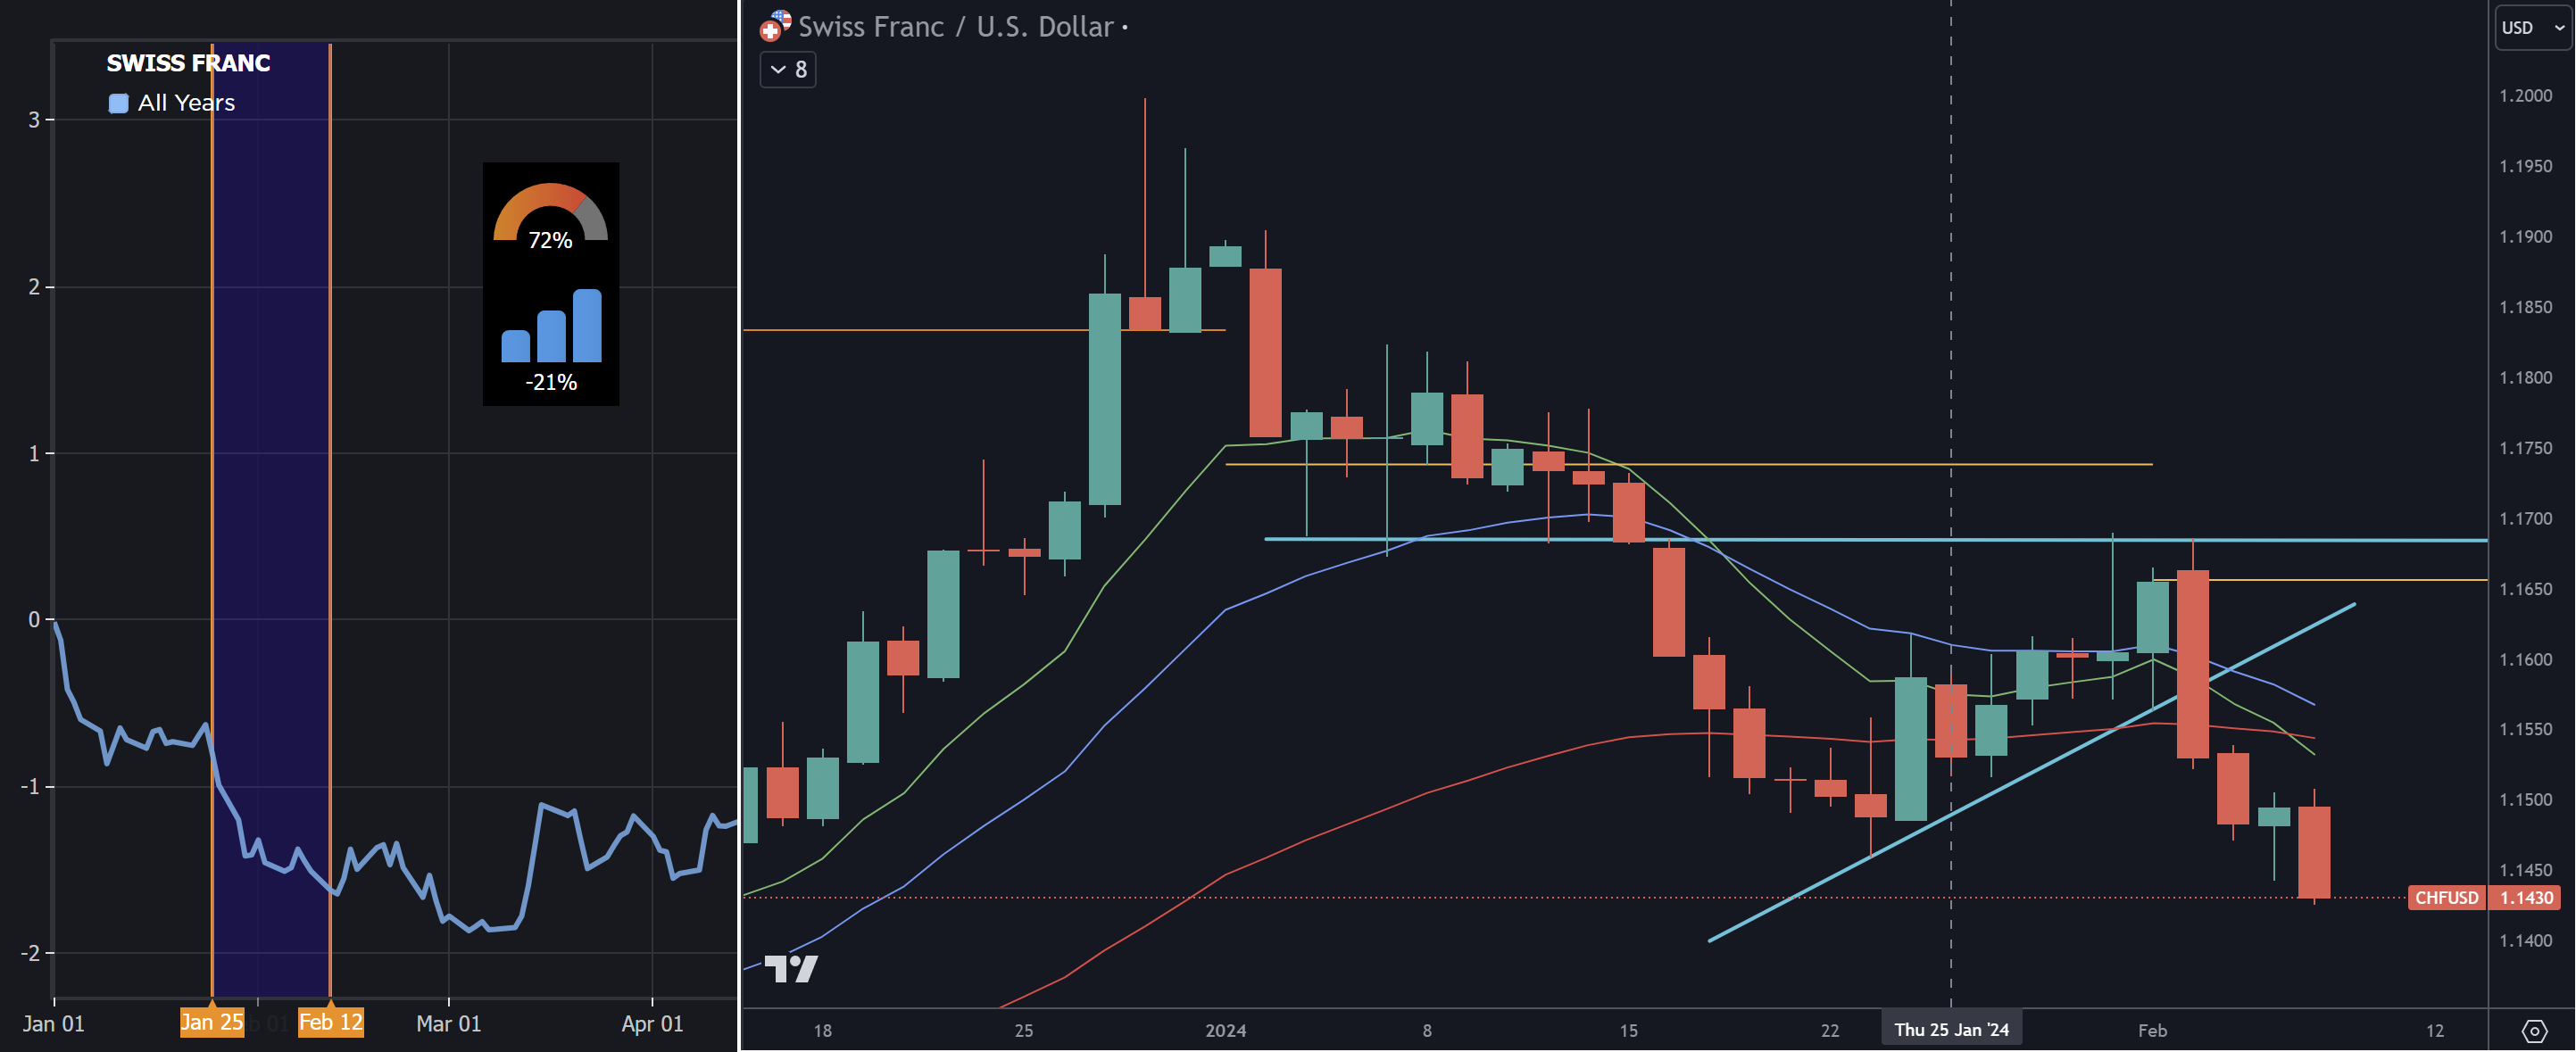
Another great example is in the Swiss Franc (CHFUSD). It’s the same as the USDCHF chart many of you will be familiar with, but simple inverted. This time the pattern starts late. The start date is expected around January 25th as we can see from the seasonal chart. This time it is the All-years seasonal pattern as it had the strongest correlation at 88%. The chart however shows price actually started to retrace on the 24th and continued on this retracement (correction) for several more days. So clearly not a good time to be entering short in this market. Price action before the 24th was showing weak undersized selling candles following a significant move down, so it was no surprise to see strong buying on the 24th as traders started taking profit. The key now is to wait for this balance to tip back in favor of sellers before entering into this seasonal move.
Looking for areas of resistance like we can see on this chart, just below 1.1700, and for price action like the bearish engulfing candle breaking support and confirming the switch to selling once again on 2nd February, are simple techniques to incorporate into your trading strategy when utilizing seasonal patterns to ensure you get the most efficient entry.
The success rate of our AI seasonal patterns is fantastic, but they can be improved with simple trade entry confirmations and trade management techniques. Follow these simple steps of using our seasonal software to find markets that are strongly correlated with a seasonal pattern (50% or greater), and then look at the chart to find a confirmed and maximally efficient trade entry. Then simply manage that position to ensure winners don’t become losers, and you will have your very own trading strategy with a success rate of at least 80%.
Happy Trading
Ray Gilmour
Founder & Senior analyst at Markets Made Clear.com