What we can learn from extreme price action
What a year we just had. With
Brexit,
Trump and the
FED, 2016 produced some of the most extreme periods of market volatility I have seen for many years. Trading during these periods was extremely tough, and if you were one of the many who tried, you will have been very fortunate not to have
lost any money. Many traders did of course decide not to get involved in markets around these times, and instead wait for them to pass and
volatility to fall, before entering again.
Sounds like a very smart move considering the uncertainty around likely market direction, but why then did I see as many traders lose money after these events as I did during? Let’s look at what we can learn from the markets in 2016 to find out.
The problem lays in
misreading the chart, with traders placing too much emphasis on either the trend before the event or the direction the market moved during the event. Here are two scenarios to illustrate what I mean.
A and
B below in
Figure 1, show two separate markets exhibiting very similar conditions prior to an extreme event which caused what I will refer to from here on as an ‘
Over-sized’ bar (an oversized bar is any bar that is at least
3 times larger than the average bar).
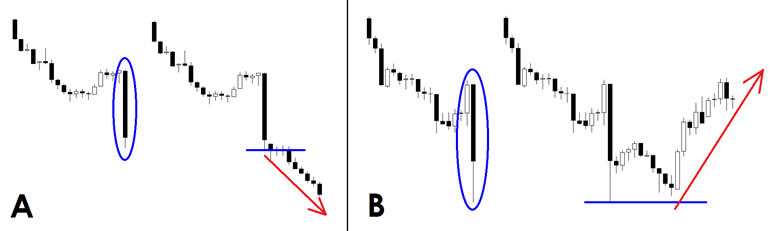 Figure 1
. Oversized bars and how they played out after their formation.
In both
A and
B, price had been trending lower leading up to their respective oversized seller bars, but their reaction was very different. In scenario
A, price continued to move lower,
breaking the low of the oversized bar (blue line) with the very next bar. However, in scenario
B, price
stalled following the oversized bar before reversing, pushing the price higher and
never breaking the low of the oversized bar. Two very similar market with very different outcomes.
Want to read your charts like a pro?
Now your charts can update automatically as the market moves, to show you every confirmed high and low cycle using
our
Matrix rules.
Available on MT4,
Cycle Finder Pro™ is a unique indicator that will make sure you never read a chart wrong again.
So, what should you do when an oversized bar occurs. The simple answer is absolutely nothing. It is not enough to wait until the event passes, you should wait until the market confirms to you after the event, where it is going. (The confirmation I am referring to here is on the
Daily time frame)
To do this a market must do one of two things before you should consider entering that market again.
1. Break and close outside the oversized bar. This should happen quickly, ideally with the very next bar but it can take a few bars to do this.
2. If price does not break and close outside the oversized bar quickly but instead
remains inside it, you must wait for
new cycles to be produced to confirm the markets trend. In this event, the chart has effectively been reset and we are waiting for two new complete cycles.
Let’s look at another two examples in detail to show you what I mean.
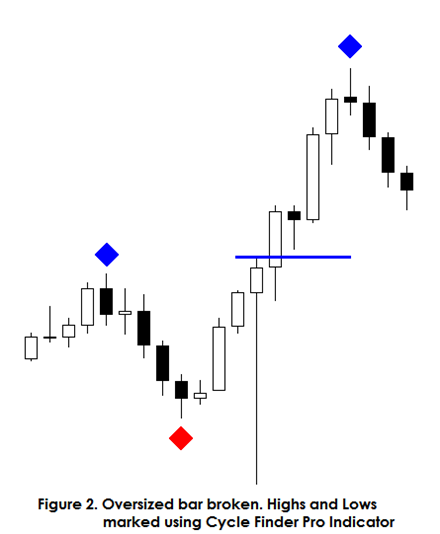 Figure 2.
 is another example of scenario A from above. Notice how price had been moving up prior to the oversized bar, and continued higher immediately after,
breaking and
closing above the oversized bar with the very next bar (day). In this scenario, the market has shrugged off what has happened and by closing above it has now
confirmed that it wants to push higher. Once it has done this, it is
safe to re-enter this market.
In this example I have also marked the cycle highs and lows to show you how this should be done. Because the market has ignored what has happened during the extreme volatility event and continued in its prior direction, we can ignore it when identifying the cycles on the chart.
This is a very important point as doing it any other way will make reading the chart very confusing.
Figure 3 however is very different. Here we see scenario B in detail, notice how price initially tried to push lower following the oversized seller bar but got bought back on the bars (days) that followed and importantly never found the momentum to break the low of the oversized bar as had happened in scenario A. Instead price remained inside the oversized bar for some time, eventually making new cycle highs and lows. Price then broke the previous downtrend by breaking above the most recent high on bar 12 following the oversized bar.
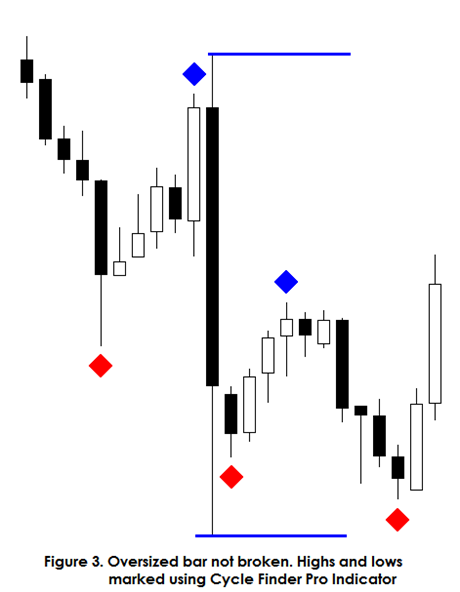
It is advised in this scenario that the market be watched until price either breaks outside the oversized bar or a new trend is made.
On a daily chart this will take multiple weeks so be patient.
Conclusion
At no point as traders are we ever forced to enter a market. If a market behaves in an unusual or abnormal way (like those in figures 2 and 3)
do not automatically expect it to then continue to behave as it were before the abnormal movement. Something
different has happened therefore what has gone before has passed.
STOP, take a step back from this market and wait for the market to tell you were it is going, rather than assuming you already know.
Remember this and 2017 could be the year for a major breakthrough in your trading.
For more information on chart reading, check our full guide, ‘
How to read a chart’.
By Ray Gilmour